Jaguar XF Insurance Cost
Full coverage for a Jaguar XF costs about $1,675 a year ($140/month) by our estimate — ▲ +5% versus the average vehicle.
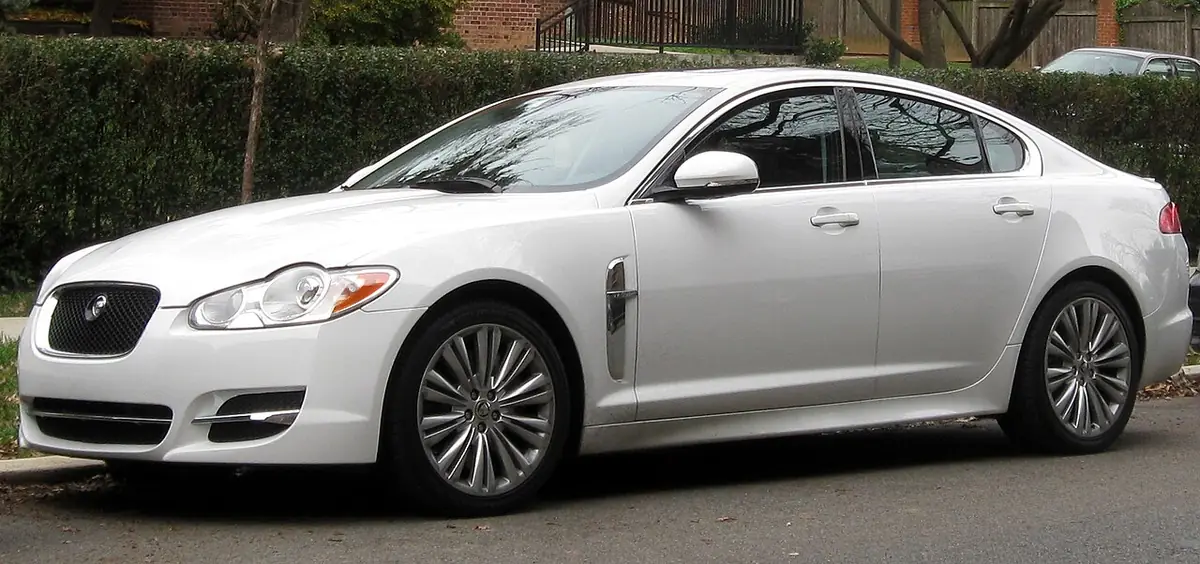
Jaguar XF insurance cost at a glance
These figures assume a driver in their 30s with a clean record, 7,500–12,000 miles a year, $500 deductibles and national-average base rates, for the 2024 model year. Our vehicle data covers the 2009–2024 model years of the Jaguar XF, which is no longer in production.
| Coverage level | What it includes | Per year | Per month | Typical range |
|---|---|---|---|---|
| State minimum liability | Only the liability (and PIP/UM where required) limits your state mandates. No coverage for your own car. | $600 | $50 | $495–$710 |
| Standard liability (100/300/100) | Higher liability limits plus uninsured motorist coverage. Still no coverage for damage to your own car. | $870 | $73 | $715–$1,030 |
| Full coverage | Standard liability plus collision and comprehensive, typically required on a financed or leased car. | $1,675 | $140 | $1,375–$1,975 |
What drives the cost of insuring a Jaguar XF
The strongest predictor of what insurers charge for a specific model is its claims history. HLDI publishes relative insurance losses for recent models (2022-2024), where 100 is the average of all passenger vehicles. The Jaguar XF's results put our vehicle factor at 0.98× for liability, 1.36× for collision and 1.25× for comprehensive.
| Coverage | Index | Rating | What it measures |
|---|---|---|---|
| Collision | 135 | Much worse than average | Damage to this car in crashes; driven by repair costs and crash frequency |
- Repair and parts costs: Luxury car from a luxury brand — premium parts, sensors and labor rates raise collision claims.
- Recalls & complaints: 1 NHTSA recall campaigns and 4 owner complaints across its latest three model years. Recalls don't change premiums directly, but open recalls should be fixed.
Jaguar XF trims and configurations (2024)
Higher trims with bigger engines, all-wheel drive or more technology usually cost more to repair or replace, which raises collision and comprehensive premiums.
| Configuration | Drive | Engine | MPG (comb.) |
|---|---|---|---|
| XF P250 | RWD | 2.0L 4-cyl Turbo | 26 |
| XF P300 AWD | AWD | 2.0L 4-cyl Turbo | 24 |
Jaguar XF insurance cost by model year
Older model years cost less to insure for full coverage because the car is worth less, so collision and comprehensive payouts are smaller. Liability costs stay about the same.
| Model year | Engines | Drive | MPG | Est. full / yr |
|---|---|---|---|---|
| 2024 | 2.0L 4-cyl Turbo | AWD, RWD | 24–26 | $1,675 |
| 2023 | 2.0L 4-cyl Turbo | AWD, RWD | 25–28 | $1,635 |
| 2022 | 2.0L 4-cyl Turbo | AWD, RWD | 25–28 | $1,590 |
| 2021 | 2.0L 4-cyl Turbo | AWD, RWD | 25–28 | $1,550 |
| 2020 | 2.0L 4-cyl Turbo, 3.0L 6-cyl Supercharged | AWD, RWD | 21–28 | $1,510 |
| 2019 | 2.0L 4-cyl Turbo, 2.0L 4-cyl Turbo Diesel, 3.0L 6-cyl Supercharged | AWD, RWD | 21–35 | $1,465 |
| 2018 | 2.0L 4-cyl Turbo, 2.0L 4-cyl Turbo Diesel, 3.0L 6-cyl Supercharged | AWD, RWD | 21–35 | $1,425 |
| 2017 | 2.0L 4-cyl Turbo Diesel, 3.0L 6-cyl Supercharged | AWD, RWD | 23–35 | $1,380 |
| 2016 | 3.0L 6-cyl Supercharged | AWD, RWD | 23 | $1,340 |
| 2015 | 2.0L 4-cyl Turbo, 3.0L 6-cyl Supercharged, 5.0L 8-cyl Supercharged | AWD, RWD | 18–23 | $1,335 |
| 2014 | 2.0L 4-cyl Turbo, 3.0L 6-cyl Supercharged, 5.0L 8-cyl Supercharged | AWD, RWD | 18–23 | $1,335 |
| 2013 | 2.0L 4-cyl Turbo, 3.0L 6-cyl Supercharged, 5.0L 8-cyl Supercharged | AWD, RWD | 18–23 | $1,335 |
| 2012 | 5.0L 8-cyl, 5.0L 8-cyl Supercharged | RWD | 17–19 | $1,335 |
| 2011 | 5.0L 8-cyl, 5.0L 8-cyl Supercharged | RWD | 17–19 | $1,335 |
| 2010 | 4.2L 8-cyl, 5.0L 8-cyl, 5.0L 8-cyl Supercharged | RWD | 17–19 | $1,335 |
| 2009 | 4.2L 8-cyl, 4.2L 8-cyl Supercharged | RWD | 17–19 | $1,335 |
Jaguar XF insurance cost by state
The same car can cost very different amounts to insure depending on where it is garaged. Select a state for its rules and city-level costs, or open the XF page for that state.
Jaguar XF insurance by driver profile
| Driver | Minimum | Standard | Full coverage | Full / month |
|---|---|---|---|---|
| Teen driver (18, own policy) | $1,655 | $2,400 | $4,605 | $384 |
| Young adult (22) | $965 | $1,395 | $2,680 | $223 |
| Adult in their 30s | $600 | $870 | $1,675 | $140 |
| Adult in their 50s | $555 | $805 | $1,540 | $128 |
| Senior (72) | $675 | $975 | $1,875 | $156 |
| 30s, one at-fault accident | $870 | $1,265 | $2,430 | $203 |
| 30s, DUI on record | $1,115 | $1,615 | $3,100 | $258 |
Jaguar XF vs. rivals
| Model | Full coverage / yr | HLDI collision | HLDI comprehensive | Comparison |
|---|---|---|---|---|
| Jaguar XF | $1,675 | 135 | — | — |
| Audi A4 | $1,565 | 133 | 97 | Compare |
| BMW 3 Series | $1,880 | 144 | 111 | Compare |
| Mercedes-Benz E-Class | $1,810 | 138 | — | Compare |
Estimate Jaguar XF insurance for your ZIP code
Runs in your browser — nothing you enter is stored or sent to insurers.
Other Jaguar models
Frequently asked questions
How much is insurance for a Jaguar XF?
We estimate about $1,675 a year ($140 a month) for full coverage and $600 for state-minimum liability, for a driver in their 30s with a clean record at national-average rates. That is 5% more than the average vehicle.
Is the Jaguar XF expensive to insure?
HLDI insurance-loss data rates it at 135 for collision and 0 for comprehensive losses (100 = average of all vehicles), meaning collision losses are much worse than average.
Which state is cheapest to insure a Jaguar XF?
Maine has the lowest estimate (about $1,075 a year for full coverage) and Florida the highest (about $2,335).
Is the Jaguar XF cheaper to insure than the Audi A4?
By our estimate the Jaguar XF costs about $1,675 a year versus $1,640 for the Audi A4, making the Audi A4 cheaper to insure.
How much is Jaguar XF insurance for a teen driver?
An 18-year-old on their own full-coverage policy would pay about $4,605 a year at national-average rates by our estimate.
How we estimate this
We start from the state's average liability, collision and comprehensive premiums published by the NAIC, then apply a location factor (population density and commute time from the Census ACS, weather hazard scores from FEMA's National Risk Index), a vehicle factor (HLDI insurance-loss data where available, otherwise vehicle segment), and a driver-profile multiplier. Results are rounded ranges for comparison, not quotes. Read the full methodology.