Land Rover Insurance Cost
Across 7 current Land Rover models, full coverage averages about $1,842 a year by our estimate — +16% versus the average vehicle ($1,590).
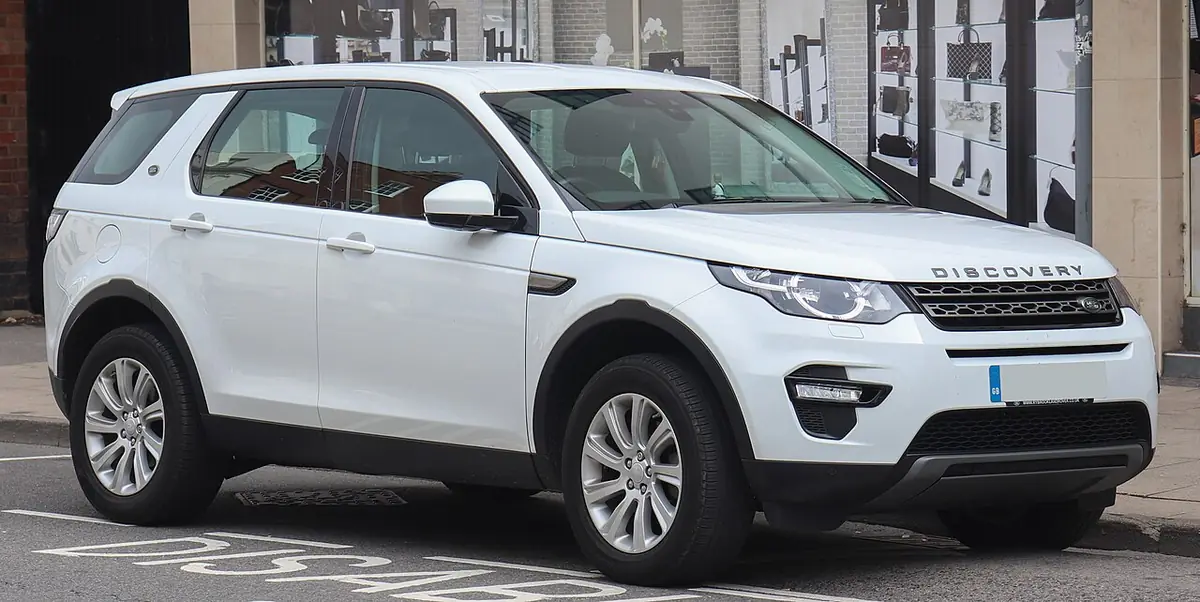
Land Rover insurance profile
Land Rover is a luxury brand, so repair parts, sensors and labor tend to cost more. Its current lineup includes 7 luxury suvs. HLDI collision losses for its models average 136 (100 = all-vehicle average).
Every Land Rover model ranked by insurance cost
| Model | Segment | Model years | HLDI collision | Est. full / yr | vs. avg car |
|---|---|---|---|---|---|
| Discovery Sport | Luxury SUV | 2015–2026 | 113 | $1,635 | +3% |
| Range Rover Evoque | Luxury SUV | 2012–2026 | 128 | $1,635 | +3% |
| Discovery | Luxury SUV | 2017–2026 | 116 | $1,665 | +5% |
| Defender | Luxury SUV | 2020–2027 | 126 | $1,815 | +14% |
| Range Rover Sport | Luxury SUV | 2006–2027 | 135 | $1,885 | +19% |
| Range Rover Velar | Luxury SUV | 2018–2026 | 175 | $2,050 | +29% |
| Range Rover | Luxury SUV | 2005–2027 | 157 | $2,210 | +39% |
Older and discontinued Land Rover models
- LR4 2010–2016
- LR2 2008–2015
- LR3 2005–2009
- Freelander 2005–2005
What makes Land Rover insurance cost more or less
- Luxury parts and labor: premium materials, advanced driver-assistance sensors and dealer-only repairs raise collision claim costs.
- Claims history: HLDI collision indices across 7 models range from 113 to 175, so the model you pick matters as much as the brand.
- Segment mix: 7 luxury suv.
Average Land Rover insurance cost by state
Average full-coverage estimate across current Land Rover models, cheapest state first.
| State | Avg. full coverage | vs. national |
|---|---|---|
| Maine | $1,218 | −34% |
| Vermont | $1,281 | −30% |
| Idaho | $1,282 | −30% |
| Hawaii | $1,289 | −30% |
| Wisconsin | $1,341 | −27% |
| North Dakota | $1,342 | −27% |
| New Hampshire | $1,346 | −27% |
| Indiana | $1,356 | −26% |
| Ohio | $1,364 | −26% |
| Iowa | $1,396 | −24% |
| North Carolina | $1,461 | −21% |
| Washington | $1,564 | −15% |
| Kentucky | $1,571 | −15% |
| Tennessee | $1,602 | −13% |
| Oregon | $1,604 | −13% |
| Virginia | $1,608 | −13% |
| Kansas | $1,620 | −12% |
| Nebraska | $1,621 | −12% |
| Utah | $1,625 | −12% |
| Montana | $1,631 | −11% |
| Alaska | $1,633 | −11% |
| Illinois | $1,645 | −11% |
| Minnesota | $1,651 | −10% |
| West Virginia | $1,655 | −10% |
| South Dakota | $1,659 | −10% |
| Alabama | $1,676 | −9% |
| Wyoming | $1,679 | −9% |
| Pennsylvania | $1,684 | −9% |
| New Mexico | $1,715 | −7% |
| Arkansas | $1,741 | −5% |
| Missouri | $1,764 | −4% |
| Oklahoma | $1,791 | −3% |
| Massachusetts | $1,819 | −1% |
| California | $1,825 | −1% |
| Mississippi | $1,860 | +1% |
| Connecticut | $1,909 | +4% |
| South Carolina | $1,943 | +5% |
| Arizona | $1,956 | +6% |
| Delaware | $1,969 | +7% |
| Nevada | $1,974 | +7% |
| Michigan | $2,041 | +11% |
| Maryland | $2,049 | +11% |
| New Jersey | $2,116 | +15% |
| Rhode Island | $2,156 | +17% |
| Georgia | $2,206 | +20% |
| Colorado | $2,229 | +21% |
| Texas | $2,304 | +25% |
| District of Columbia | $2,355 | +28% |
| New York | $2,396 | +30% |
| Florida | $2,484 | +35% |
| Louisiana | $2,570 | +40% |
Frequently asked questions
How much does it cost to insure a Land Rover?
Across 7 current Land Rover models, our full-coverage estimate averages $1,842 a year for a driver in their 30s with a clean record, 16% more than the average vehicle ($1,590).
What is the cheapest Land Rover to insure?
The Land Rover Discovery Sport has the lowest estimate at about $1,635 a year for full coverage; the Land Rover Range Rover is the most expensive at about $2,210.
Are Land Rover repairs expensive for insurers?
HLDI collision-loss data for 7 Land Rover models averages 136 (100 = average of all vehicles), which is much worse than average. Collision losses combine how often claims happen and how much repairs cost.
Where is it cheapest to insure a Land Rover?
By our estimates, Maine is the cheapest state (about $1,218 a year on average across current models) and Louisiana the most expensive (about $2,570).
How we estimate this
We start from the state's average liability, collision and comprehensive premiums published by the NAIC, then apply a location factor (population density and commute time from the Census ACS, weather hazard scores from FEMA's National Risk Index), a vehicle factor (HLDI insurance-loss data where available, otherwise vehicle segment), and a driver-profile multiplier. Results are rounded ranges for comparison, not quotes. Read the full methodology.