Pontiac Insurance Cost
Across 15 Pontiac models, full coverage averages about $1,255 a year by our estimate — −21% versus the average vehicle ($1,590).
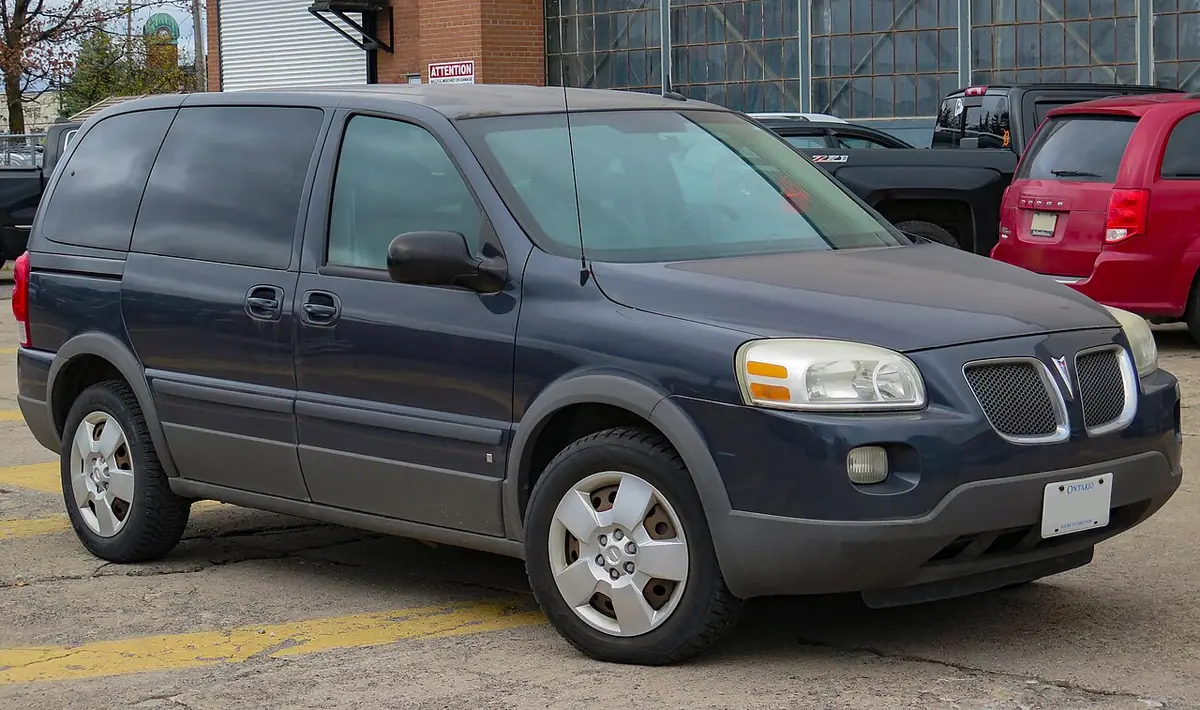
Pontiac insurance profile
Pontiac’s lineup is made up mostly of 4 compact cars, 2 subcompact cars, and 2 sports cars.
Every Pontiac model ranked by insurance cost
| Model | Segment | Model years | HLDI collision | Est. full / yr | vs. avg car |
|---|---|---|---|---|---|
| Montana | Minivan | 2005–2006 | — | $1,135 | −29% |
| Torrent | Small SUV | 2006–2009 | — | $1,165 | −27% |
| Aztek | Midsize SUV | 2005–2005 | — | $1,190 | −25% |
| G3 | Subcompact car | 2009–2010 | — | $1,220 | −23% |
| Wave | Subcompact car | 2005–2006 | — | $1,220 | −23% |
| G5 | Compact car | 2007–2010 | — | $1,245 | −22% |
| Vibe | Compact car | 2005–2010 | — | $1,245 | −22% |
| Grand Am | Compact car | 2005–2005 | — | $1,245 | −22% |
| Sunfire | Compact car | 2005–2005 | — | $1,245 | −22% |
| G6 | Midsize car | 2005–2010 | — | $1,255 | −21% |
| Grand Prix | Midsize car | 2005–2008 | — | $1,255 | −21% |
| G8 | Full-size car | 2008–2009 | — | $1,260 | −21% |
| Bonneville | Full-size car | 2005–2005 | — | $1,260 | −21% |
| Solstice | Sports car | 2006–2010 | — | $1,445 | −9% |
| GTO | Sports car | 2005–2006 | — | $1,445 | −9% |
What makes Pontiac insurance cost more or less
- Segment mix: 4 compact car, 2 subcompact car, 2 sports car, 2 midsize car, 2 full-size car, 1 small suv, 1 minivan, 1 midsize suv.
Average Pontiac insurance cost by state
Average full-coverage estimate across current Pontiac models, cheapest state first.
| State | Avg. full coverage | vs. national |
|---|---|---|
| Maine | $1,021 | −19% |
| North Dakota | $1,027 | −18% |
| Vermont | $1,043 | −17% |
| Idaho | $1,089 | −13% |
| Iowa | $1,089 | −13% |
| Wisconsin | $1,096 | −13% |
| Hawaii | $1,107 | −12% |
| Indiana | $1,140 | −9% |
| New Hampshire | $1,142 | −9% |
| Ohio | $1,146 | −9% |
| North Carolina | $1,198 | −5% |
| South Dakota | $1,226 | −2% |
| Wyoming | $1,253 | 0% |
| Montana | $1,279 | +2% |
| Kansas | $1,281 | +2% |
| Nebraska | $1,284 | +2% |
| Tennessee | $1,333 | +6% |
| Minnesota | $1,338 | +7% |
| West Virginia | $1,340 | +7% |
| Kentucky | $1,350 | +8% |
| Virginia | $1,379 | +10% |
| Illinois | $1,392 | +11% |
| Alabama | $1,397 | +11% |
| Washington | $1,397 | +11% |
| Pennsylvania | $1,401 | +12% |
| Alaska | $1,406 | +12% |
| Arkansas | $1,413 | +13% |
| New Mexico | $1,439 | +15% |
| Oregon | $1,439 | +15% |
| Oklahoma | $1,445 | +15% |
| Utah | $1,454 | +16% |
| Missouri | $1,455 | +16% |
| Mississippi | $1,532 | +22% |
| California | $1,574 | +25% |
| Massachusetts | $1,578 | +26% |
| Arizona | $1,681 | +34% |
| Connecticut | $1,705 | +36% |
| South Carolina | $1,712 | +36% |
| Michigan | $1,749 | +39% |
| Delaware | $1,789 | +43% |
| Maryland | $1,800 | +43% |
| Colorado | $1,820 | +45% |
| Nevada | $1,840 | +47% |
| Texas | $1,900 | +51% |
| New Jersey | $1,931 | +54% |
| Rhode Island | $1,936 | +54% |
| Georgia | $1,984 | +58% |
| District of Columbia | $2,021 | +61% |
| New York | $2,151 | +71% |
| Louisiana | $2,217 | +77% |
| Florida | $2,289 | +82% |
Frequently asked questions
How much does it cost to insure a Pontiac?
Across 15 current Pontiac models, our full-coverage estimate averages $1,255 a year for a driver in their 30s with a clean record, 21% less than the average vehicle ($1,590).
What is the cheapest Pontiac to insure?
The Pontiac Montana has the lowest estimate at about $1,135 a year for full coverage; the Pontiac GTO is the most expensive at about $1,445.
Where is it cheapest to insure a Pontiac?
By our estimates, Maine is the cheapest state (about $1,021 a year on average across current models) and Florida the most expensive (about $2,289).
How we estimate this
We start from the state's average liability, collision and comprehensive premiums published by the NAIC, then apply a location factor (population density and commute time from the Census ACS, weather hazard scores from FEMA's National Risk Index), a vehicle factor (HLDI insurance-loss data where available, otherwise vehicle segment), and a driver-profile multiplier. Results are rounded ranges for comparison, not quotes. Read the full methodology.